Introduction
For many years, I have spent time at airports in many parts of the world and seen large numbers of planes from the same airline on the ground. For example, at DXB, we can see many Emirates Airlines’ aircraft at their gates, on the ground at any time. The same is true at LHR, SIN and at more airports.
In January of this year, I began to gather data via www.flightradar24.com that might show me two key things: how many aircraft are in the fleets of the airlines I chose to investigate and at any time, how many of those aircraft are in the air, serving passengers or delivering freight?
Number of Records
The report I have created is available from the download you see below and some of the highlights of the report are:
|
Airline |
Number of Data Points |
|
Emirates
Airlines |
207 |
|
British
Airways |
199 |
|
United
Airlines |
199 |
|
Singapore
Airlines |
178 |
|
Ryanair |
178 |
That is, for example, I recorded Emirates' flight data 207 times , British Airways 199 times and so on.
24 Hour Summaries
The 24 hour profile of Emirates Airlines can be summarised in this radar chart:

Download and read the report to contrast Emirates' profile with that of the other four airlines, most notably Ryanair!
Plotting the same data on a scattar graph, again for Emirates, shows this:
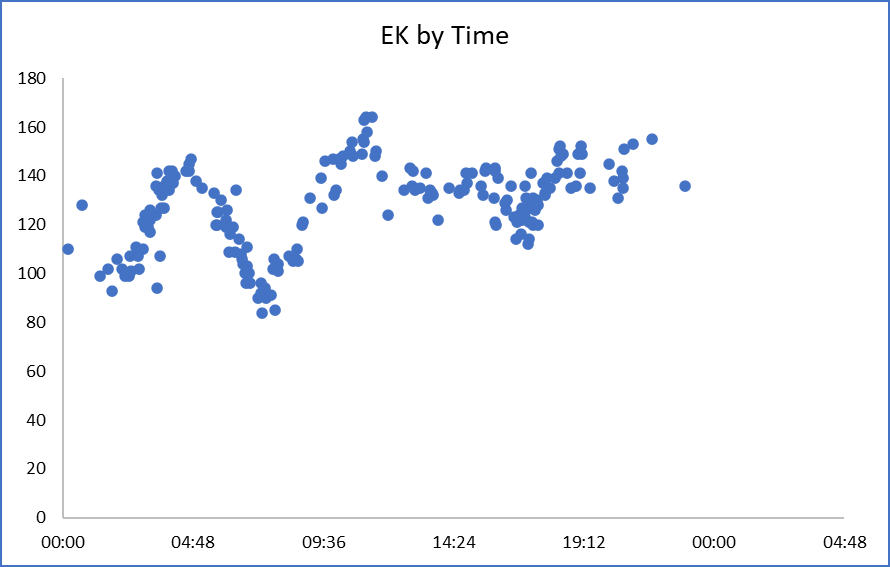
As opposed to the same chart for Ryanair:

Again, read my report to see the equivalent profiles for all airlines: there are significant differences between them, as you can already see with these two examples alone.
Descriptive Statistics
The descriptive statistics of the data I gathered are as follows, including the fleet sizes:

Random Sample of 30 Emirates Aircraft

And my summary of the sample is:

Conclusions
I set out to record and analyse the flight data of the aircraft of Emirates Airlines but quickly added British Airways and United Airlines to my list. I further added Singapore Airlines and Ryanair flight data to my log file and it is all of that that I have presented and analysed in this article.
The table of descriptive statistics that I presented above reveals that the average utilisation of an aircraft varies from 33.26% for United Airlines to 48.22% for Singapore Airlines: with an uncorrected maximum value of 90.91% for Singapore Airlines and a minimum value of 0.00% for Ryanair.
Duncan
Williamson
Download my report from here: PDF File
No comments:
Post a Comment