Introduction
The purpose of this page is to introduce you to the idea that we don't always need data to create tables, pivot tables and graphs. I am going to show you how to take data from a web site that's largely in the form of text, albeit with numbers in it and turn that into tables and charts.
As you might expect, it takes a little time to set up but after that, less than a minute a day for every update: that's Power Query for you!
China Covid-19 Data
This is our starting point

As you can see, there is an entry every day and while the layout is predictable now, if you go back to late January, the layout was different because everything was new.
I have attached my Excel file for you to download and continue to update and in that file I give detailed instructions of what you have to do to arrive at this:
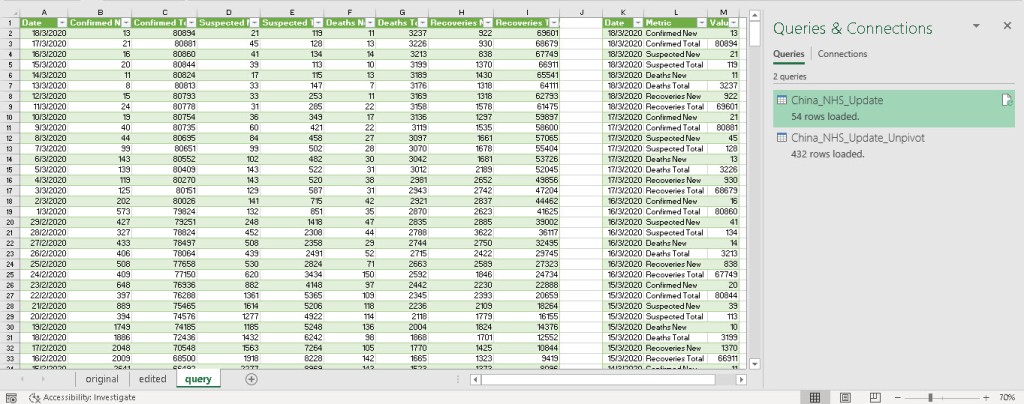
And then finish with these:

and ...

Download my Excel file from here and as always your feedback is welcome:
Duncan Williamson
22nd March 2020
No comments:
Post a Comment