Introduction
If you have stumbled across this page hoping to find a cheap Business Class seat on Singapore Airlines (SIA), sorry! What you have arrived at is a page that explains how I found a superb result to my analysis of the last 19 years of SIA's financial results.
The Data
As I was using Power Query to help me to analyse SIA's financial results, I downloaded their last 19 years' worth of Annual Reports and Accounts and from there I downloaded everything you see here:
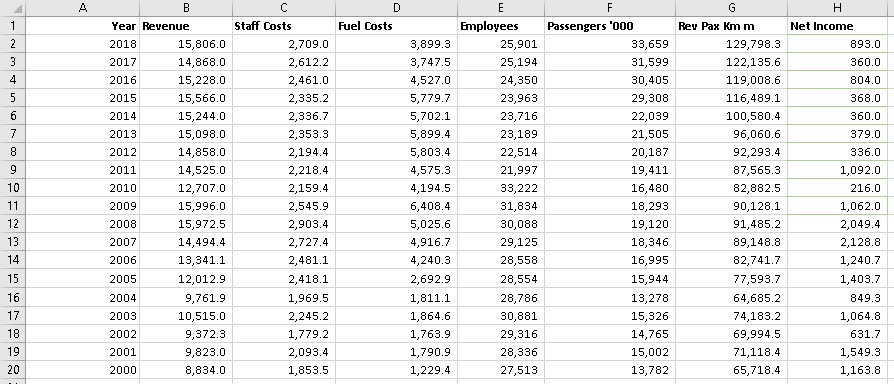
The question is, what can I do with all of that? What I often do as part of my financial analysis is to create a Net Income model. That is, I make Net Income the dependent variable and have one or more independent variables.
The First Model
My first model comprises Y = Net Income = All Other Variables in the above table, all six of them. I used the Data Analysis ToolPak for this and here is my output:
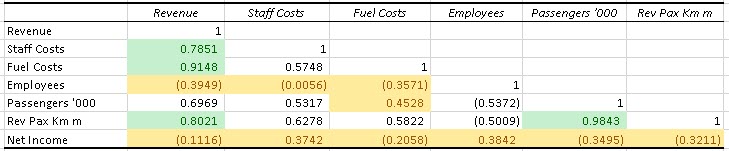
A Correlation Matrix of all variables and I have conditionally formatted the results to highlight the extreme values and the mid range values. For example, Revenue and Fuel Costs are very highly correlated as are Passengers and Rev Pax Km (Revenue Passenger Kilometers). Rather oddly, there is virtually no correlation between Staff Costs and the Number of Employees.
The Regression output are as follows:
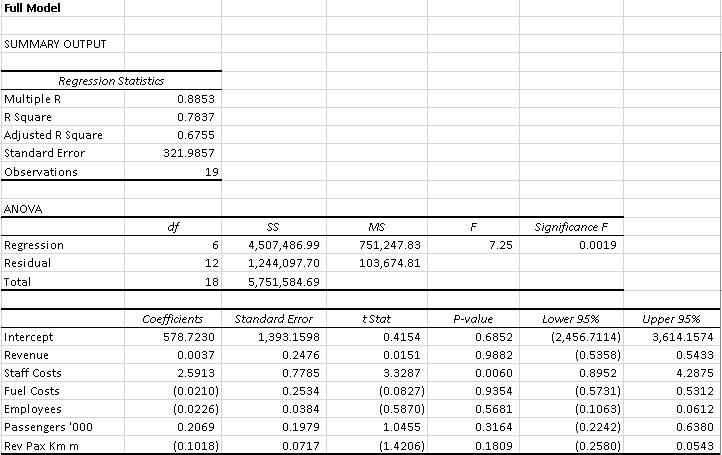
Let's note that the Adjusted R Squared value is high at 0.6755, the F statistic is significant at 7.25 but of the six independent variables only Staff Costs are significant, with a t statistic of 3.3287 and a P Value of 0.0060.
I think this is a superb result: Staff Costs being the only significant variable as its coefficient shows that a unit change to Staff Costs leads to a 2.5913 million SGD increase in Net Income.
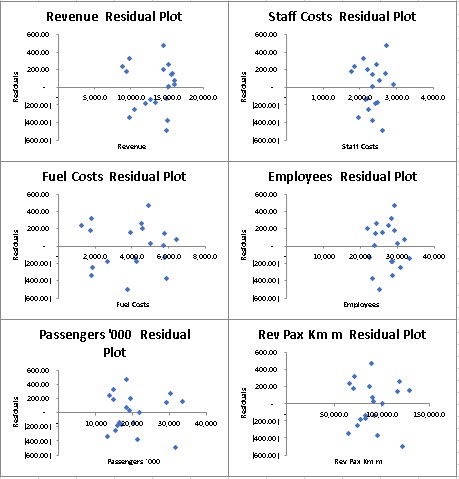
The residuals plots show that everything is probably fine although we are only dealing with 19 data points or years of data:
Conclusion
On the one hand, this model fails because only one variable is significant and using just Staff Costs to predict Net Income is not rational. This says that we need to refine or replace the model to find something better. That being true, why do I think I found something superb?
SIA is famous for its recruitment of and investment in high quality cabin crew and other members of staff. Whilst they don't pay the highest salaries, they do reward well overall, training is high level and frequent, they use more cabin crew per flight than most, if not all, of its competitors to maximise customer satisfaction.
Out of all of that, the data contain the relationships that I just mentioned and regression analysis has brought them out! That is superb in my opinion!
I want you to replicate my work here so, whilst there is a spreadsheet to download, it only contains the data I have extracted and used. Feel free to ask for advice and guidance here but I am not providing the full spreadsheet file.
Download the file of data from here sia_data_blog
Duncan Williamson
14th August 2018