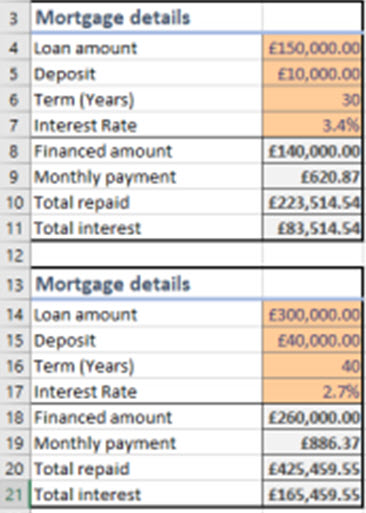
Single Mortgage Contract
Rows 3 and 4 contain a single example mortgage contract: it is based on the initial example in the article; I transposed the table and I changed the term from 30 years to 5 years. I transposed the table to help with the following examples.
The formulas you need to make this single contract example work are
- F4=B4-C4
- G4=PMT(E4,D4,-F4,0)
- H4=G4*D4
- I4=H4-F4
You can see that we need to find $30,919.63 each year to finance this mortgage.
If I wanted to find the monthly repayments, I would need to amend the formula in G4 to this:
G4=PMT(E4/12,D4*12,-F4,0)
Multi Row Mortgage Contract
I chose this example and transposed the table to make the point that while Gridlets may well be an excellent idea, one of the difficulties with the example in the article is caused, at least in part, by adopting a vertical structure to the model rather than a horizontal one. By that I mean that all I have to do to extend the single contract example is to fill down to a second, third, nth row and change the input values for each row.
The formulas I used for the Multi Row model, then, are:
- F7=LET(loan_amount,B7,deposit,C7,term_years,D7,rate,E7,loan_amount-deposit)
- G7=LET(loan_amount,B7,deposit,C7,term_years,D7,rate,E7,(TEXT(PMT(rate,term_years,-F7,0),"#,000.00")))
- H7=G7*D7
- I7=H7-F7
You might already have noticed that I used the LET() function for cells F7 and G7. At the time of writing, this is a new Excel function and it seems fitting to me that I should keep this example as up to date as possible since I am discussing here something else that might become a feature of Excel in the future! I then filled down to row n to complete my model/demonstration.
I should also discuss the input cells in my multi row model since I made life easy for myself by doing this, for example, in row 8:
- B8=B7+50000
- C8=C7+10000
- D8=5
- E8=E7+0.006
I then filled down to row n ... to complete my model/demonstration.
Assuming I have made no mistakes so far, there is no copy and paste or fill down nightmare to deal with here. I will confess, however, that I changed my model to an annual model having previously programmed the monthly version that we see in the Gridlet article ... and I forgot to remove the /12 aspect of two of my formulas for a while!
The Scenario Manager
In my work as an Excel trainer, blogger and author, I do demonstrate Excel's Scenario Manager, as found in my Excel file for this page:
I will not be discussing here how to use the Scenario Manager since that would take too long. Suffice it to say, though, that the Scenario Manager is relatively easy to use and I have used the same inputs here as for my multiple row model and the outputs I generated are:
This is a useful, neat and tidy, summary and I do know that some of my delegates/readers do use the Scenario Manager in Excel, even though it is limited to something like 30 scenarios for any model. You will see that summary on the Scenario Summary worksheet of my file.
I will say here that the ability to copy and paste in the Scenario Manager is limited. This means that the variables for each scenario have to be entered manually and the more entries we have to make, the greater the capacity for us to make mistakes.
Let me add here that I also present scenarios that use Data Validation ranges and ComboBoxes and they can be more sophisticated and flexible to deal with than the Scenario Manager. Again, I am not demonstrating that here because of time constraints!
Data Tables
I have created two Data Tables for this page:
Financed Amount v Years
Cell C18=TABLE(F4,D4) tells us that the row and column cell references are F4 and D$ for the Amount v Years table.
Financed Amount v Interest Rate
Cell C26=TABLE(F4,E4) tells us that the row and column cell references are F4 and D$ for the Amount v Rate table
One of the things that a two variable Data Table like these will do for us is to confirm our calculations. For example, we know that the first row of my multiple row model shows an annual payment of $30,919.63 and we can see that result in cell C22: Financed Amount $140,000 for 5 Years. Similarly for the Amount v Rate Table, $140,000 at 3.40%.
Data Tables Using Dynamic Array Formulas
Again, keeping us up to date, I have created a third Table: this Table uses the relatively new dynamic array functions. Unlike the two Tables in the previous section, what follows is not formally a Data Table.
Cell A34=7 ... the number of columns I want my Table to have ... it does not have to be 7 ... change it
Cell A35=7 ... the number of rows I want my Table to have ... it does not have to be 7 ... change it
We need to understand three formulas in my Table:
C33=SEQUENCE(,A34,140000,40000) ... SEQUENCE() is a Dynamic Array function
B34=SEQUENCE(A35,1,0.034,0.006)
C34=PMT(B34#,A35,-C33#,0) ... the # symbol is used in conjunction with a Dynamic Array function to help with determining the width and depth of the output ... 7 * 7 in this case
If you are unfamiliar with Dynamic Array functions, download and review my Excel file for this page and explore the SEQUENCE() function, in this case. As you do that, remove the # symbol from the formula in cell C34 and see what happens. Then put it back! Put it together with A35 in the formula in cell C34 and note what happens.
Finally, change the values in cells A334:A35 to, for example, 5 and 3, respectively or 6 and 10. You should find these results:
As you make those changes in my file, notice how the output Table changes the number of columns and rows automatically: this is part of the power of Dynamic Array functions.
Conclusions
The purpose of this page was to introduce the concept of the Gridlet: something that we might all get to use one day. The second purpose of the page was not to decry the Gridlets in any way but to say that by considering carefully the set up and layout of a spreadsheet model, some of the problems associated with enhancing, copying and pasting models will not be faced.
Duncan Williamson
2nd February 2021
Reference
Nima Joharizadeh, Davis
Advait Sarkar,
Andrew D. Gordon, Jack Williams
(2020) Gridlets: Reusing Spreadsheet Grids CHI EA '20: Extended Abstracts of the 2020 CHI Conference on
Human Factors in Computing Systems April 2020 Pages 1–7


No comments:
Post a Comment